Visualizations in business intelligence software are often dismissed as a “commodity” — interchangeable and easy to overlook. But this perspective misses the mark. Visualizations are the gateway to understanding; they’re how users interact with and interpret the insights derived from all the data gathering, preparation, and analysis.
This becomes especially critical in embedded analytics, where crafting the perfect dashboard or report design with the right functionality for your users can make or break their experience. Even seemingly simple elements like tables must go beyond the basics, transforming into dynamic, interactive tools that elevate data display far beyond a static grid of numbers and text.
The Managed Dashboards & Reports offered by Logi Symphony from insightsoftware are packed with features that might just surprise you — details that can make all the difference in how you and your users experience data. Here’s what you might not know you’re missing.
Customize and Freeze Totals
Large interactive tables are more than just tools for displaying data—they empower users to explore, analyze, and extract meaningful insights on their own terms. With Logi Symphony, these tables are designed to support both reporting and hands-on user-driven analysis, making them a versatile powerhouse for business intelligence.
One standout feature is the visibility and interactivity of totals. Grand totals and subtotals are always visible by default – “frozen” at the top or bottom of the table – and they dynamically update as you scroll through data. This ensures that key summary insights are always within reach, no matter how large or detailed the dataset is. Plus, the subtotal row offers a clear, real-time indicator of your position within a larger group, helping users stay oriented while analyzing complex data structures.
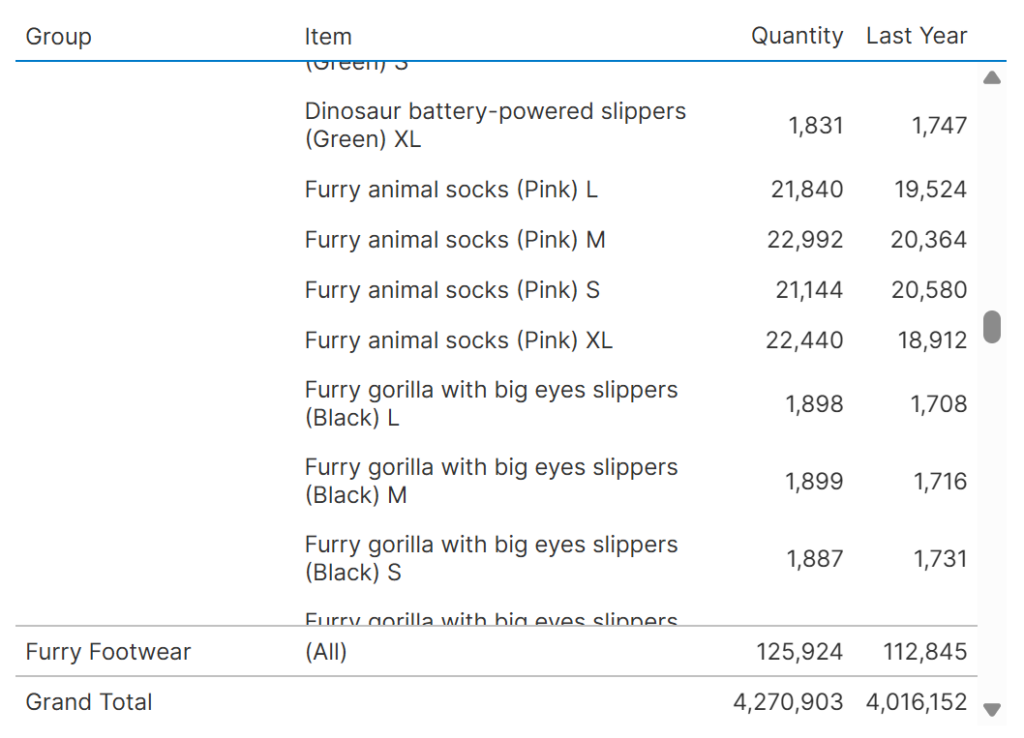
Customizing total values is effortless. With a simple click of a button, users can apply basic formulas or build custom aggregations tailored to their unique needs. Whether you’re adjusting the aggregator or incorporating custom calculations, it’s intuitive and flexible, enabling even deeper, more personalized insights.

Reordering and Regrouping
Tables are a cornerstone of data analysis, but not all tables are created equal. Many tools allow you to drag and reorder column headers—a familiar feature. However, Logi Symphony takes it further by enabling users to intuitively drag and drop “row headers” on the left. This added flexibility allows users to effortlessly regroup data by multiple dimensions during their analysis.
This feature doesn’t just shuffle columns; it transforms how data is presented. For example, you can quickly switch between grouping data by state and then category—or vice versa—with a simple drag-and-drop action. This level of interactivity lets users explore their data from different perspectives, making it easier to uncover patterns or insights that might otherwise go unnoticed.

When your analysis calls for a simpler view, removing grouping altogether is just as intuitive. With a quick click on the sorting options from the column header, you can choose “none” and sort directly by a measure instead. This seamless flexibility empowers users to customize their tables for any analysis scenario, enabling faster, clearer decision-making without breaking their flow.

Expand and Collapse Anything
When users need to “zoom out” from the granular details and see the forest from the trees, Logi Symphony makes it seamless. With just a right-click directly on the table, users can collapse details to reveal a summarized view, simplifying complex datasets into a more digestible format.

This summarized view doesn’t just condense the data—it retains the totals for the remaining dimensions, providing key insights at a glance. And when you’re ready to dive deeper into specific areas, you can easily expand individual dimensions to reveal their details.

Flexibility is at the heart of this feature. Dimension values can be expanded or collapsed effortlessly using triangular buttons within the table or through the right-click menu—even from the column headers. This level of control allows users to toggle between high-level summaries and detailed breakdowns in real-time, making it easier to adapt the view to their analysis needs.

Variance Data Bars
Transforming raw data into meaningful, context-rich analysis has never been easier with Logi Symphony. Starting with something as simple as a single column of measure data—like Quantity—you can create well-designed, actionable dashboards and reports in just a few clicks.
Here’s how it works:
- Filter for relevance: Use Slicers to narrow the data to a current time period, such as “Year to Date.” This filter is dynamic, automatically updating as time progresses to ensure your analysis stays current.
- Compare periods effortlessly: With the “Period Over Period” option in the toolbar, you can instantly add a previous period comparison. Choose an offset, such as “Backward 1 Year,” to quickly see how this year stacks up against last.
- Highlight variances with ease: Click the “Variance Columns” option, assign your Actual and Previous measures, and let the system do the rest.

The result is a beautifully structured analysis built on IBCS guidelines, complete with automatically calculated absolute and relative variances. Negative values are visually emphasized, making it easy to spot areas requiring attention. You can also compare actuals against planned data—such as budgets or forecasts—with similar ease.
While the output adheres to best practices for clarity and insight, it’s far from rigid. The results leverage Logi Symphony’s robust table and data bar options, giving you the freedom to customize every detail to align with your unique needs. This streamlined process empowers dashboard and report authors to deliver sophisticated analyses faster than ever, without sacrificing flexibility or precision.
Unlock Expert Insights: A Quick Guide to Data Preparation in Logi Symphony
Download NowScorecards
With Logi Symphony’s scorecard views, the possibilities for creating impactful tables are virtually limitless. Take, for example, this best-practice design for analyzing actual vs. budget data:

The table is enhanced with interactive, fully customizable sparklines and spark bar charts that elegantly visualize trends over the past 12 months, giving users a quick, intuitive understanding of performance over time. Bullet graphs, seamlessly integrated into the design, add another layer of insight. These graphs function just like traditional charts, complete with fully operational axis visualizations displayed in the headers, making it easy to interpret key metrics at a glance.
To further elevate clarity and usability, indicators and red coloring draw immediate attention to areas where performance is either slightly or significantly over budget. Using flexible “states,” these visual cues are easy to configure and ensure that critical variances stand out, enabling quicker decision-making.
This level of interactivity and customization allows users to build tables that not only summarize data but actively guide analysis and highlight actionable insights.
Giving input
Logi Symphony provides unparalleled flexibility, empowering authors and viewers to tailor data to their unique needs—even beyond traditional table configurations.
For instance, you can create a custom formula that allows viewers to input their own values using a placeholder like $Parameter$. This placeholder can then be connected to a filter, such as the one labeled “Markup” in the example below, to dynamically adjust the data displayed in real-time.

But it gets even better: without any prior setup, users with the appropriate permissions can right-click any cell and select “Correct Value” to input their own data. This feature can be used privately for personal analysis or shared with others as needed, with a clear, prominent note attached to explain the modification. This transparency ensures collaborative accuracy while still allowing for flexibility.
For authors who need to add their own targets, metrics, or other custom data, the Contextual Measure feature makes it simple to insert a new column of values. Need to go even further? You can also input or paste an entire table of data—just like working in a spreadsheet—making it easy to add detailed, personalized information.
The Basics
Sometimes it’s the simplest features that make the biggest difference—features you might not even notice until they’re missing. Take column widths, for example. In Logi Symphony, they automatically adjust by default to fit their contents, ensuring your data always looks clean and organized. At the same time, both authors and viewers have full control to manually resize columns or wrap long text onto multiple lines as needed, offering flexibility for clearer, more readable layouts, as shown in the first table example.
Another powerful customization is the ability to choose how row headers are displayed. Opt for separate columns for each dimension or level, or consolidate them into a single column with indented levels for a cleaner, more compact view. This adaptability ensures that your tables are not just functional but also perfectly tailored to the data and the story you’re trying to tell.

Logi Symphony: Empowering Data-Driven Insights with Seamless Customization
Logi Symphony from insightsoftware and its Managed Dashboards & Reports are designed with one goal in mind: empowering you to create the perfect content to share with your users. Every detail has been carefully considered to provide a seamless, intuitive experience that turns raw data into actionable insights.
From flexible, interactive tables to advanced customization options, Logi Symphony ensures that you and your users have everything needed to analyze, collaborate, and present data effectively. Whether it’s tailoring column widths, building dynamic scorecards, or enabling personalized user input, every feature is designed to make your data work harder and smarter.
We’ve thought about the details, so you don’t have to. With these powerful tools at your disposal, you can focus on what really matters: delivering insights that drive smarter decisions, faster. It’s more than just dashboards and reports—it’s a platform that empowers you to tell the right story with your data, every time.
The post Table Stakes: Can Your Tables Do This? appeared first on insightsoftware.